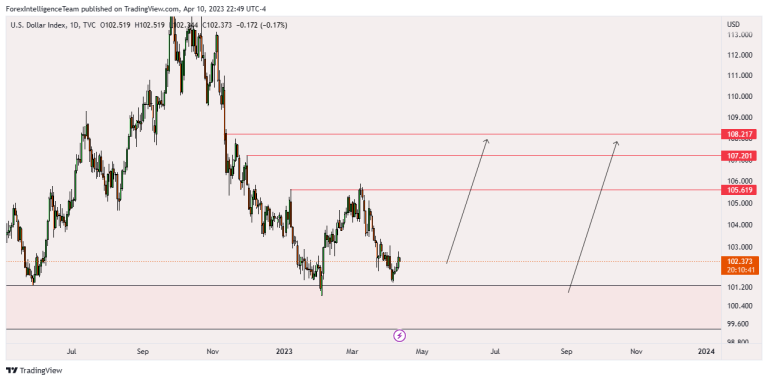
depending on the Bond Market charts ( 5,10,20 and 30 years bond charts ) also according to yields charts ( 5,10,20, and 30 years ) DXY may starts a rally pull as a retracement for the bearish movement since November .
as shown on the chart below the main zone for buyers , and the main targets ” highs ” .