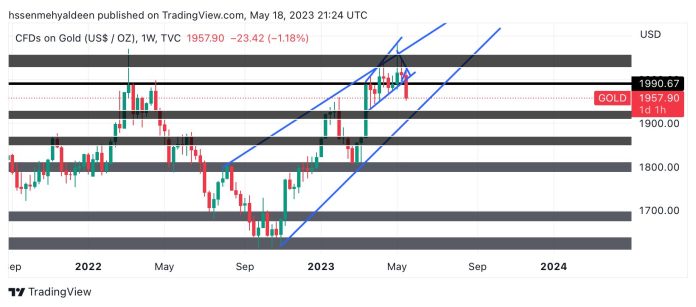
Gold on the weekly time frame (1W):
It is an uptrend problem and it is trading inside this trend.
If we take Fibonacci from the bottom of (1600), it has retracement areas from (1790) to (1850).
And if we take the Fibonacci from the bottom to the top of (1600), which is (1800), it has the retracement areas from (1870) to (1900/1910). Change the balance of analysis
The important areas that are considered areas of demand and it is possible that gold will rebound from us are (1910/1900), in the event of a break, they are the areas, we will see areas (1790/1850)
Of course, this analysis needs time to be achieved, given that it is on a weekly basis.


