https://ar.tradingview.com/chart/NASDAQ/4w13Py4C/
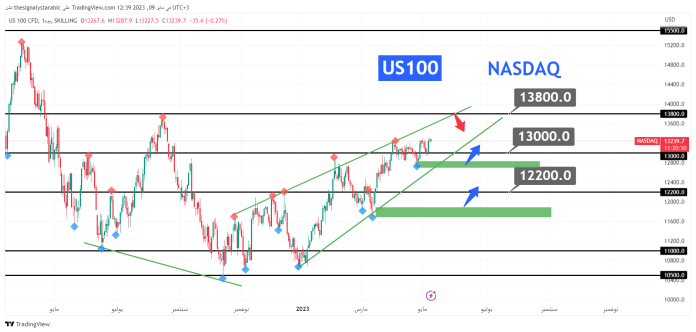
The NASDAQ was in a downward trend forming lower peaks than the previous peaks and lower bottoms than the previous bottoms, and this is an indication of the downward trend, but when the matter changed the pattern changed to the formation of higher peaks than the previous peaks and higher bottoms than the previous bottoms, this is clear evidence of the change of trend from a bearish to an upward trend new .
Also, the bullish divergence on the MACD indicator, which gave a bullish signal or changed the direction, in addition to the support area from which the NASDAQ was expected to rise. These things combined changed the direction from bearish to bullish.
Currently, the price is forming a rising wedge and is concentrating around the support area, from which it heads to the resistance area and the upper trend area of the wedge pattern, which considers this area to be overbought and a bearish rebound is expected from it.
I hope to like and follow
anh trai của bạn


