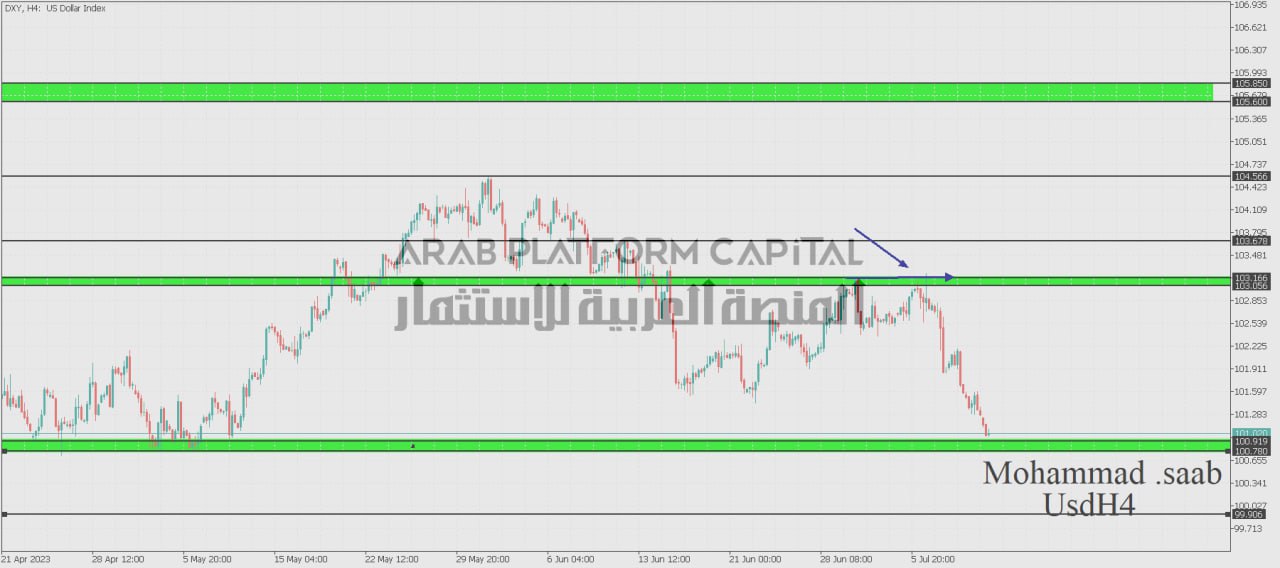
dollar index:
The most important area (100.780 – 100.919) price stability above the most important area with a four-hour candle, the price heads to the resistance area (103.056 – 103.166), the possibility of a bounce from it is possible, but by breaking it and closing higher with a four-hour candle, the price heads to the resistance area (103.678)
Alternative scenario:
The most important area (100.780 – 100.919) Any break and close below the area (100.780) with a four-hour candle, the price will head to the support area (99.906)
Support points: 100,780 – 99,906
Resistance points: 103.166 – 103.678
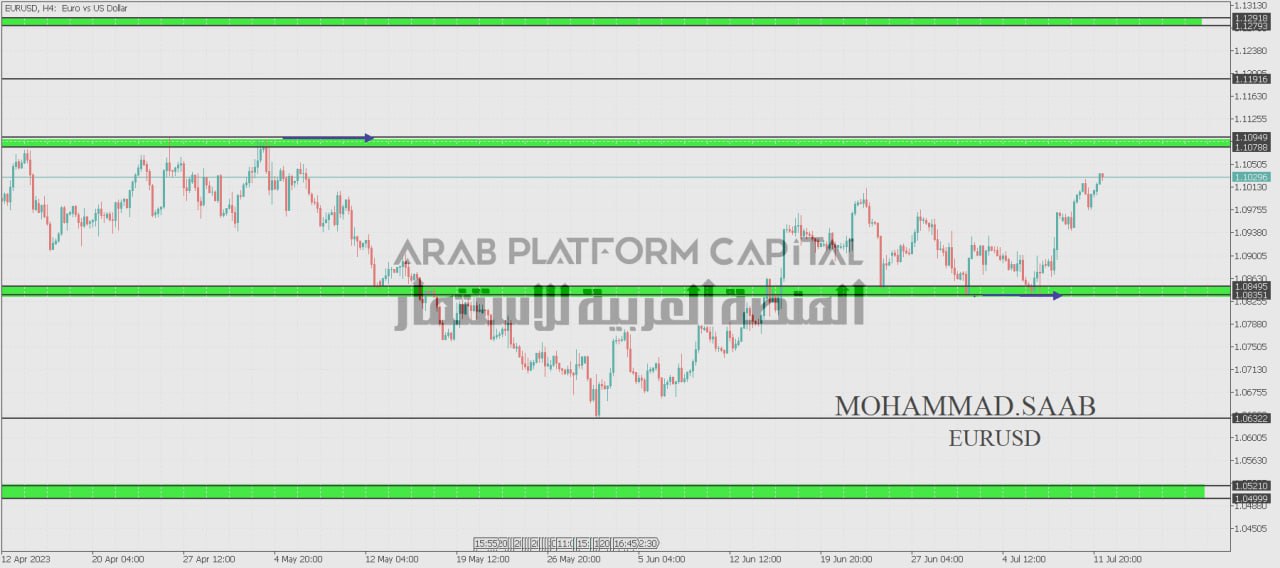
Eurodollar pair indicator:
The most important area (1.10788 – 1.10949) The possibility of the price rising to the area (1.10949) and then bouncing back to the support area (1.08351 – 1.08495) The possibility of a bounce is possible, but by breaking it and closing below with the four-hour candle, the price will head to the support area (1.06322)
Alternative scenario:
The most important area (1.10788 – 1.10949), i.e. breaking and closing above the area (1.10949) with a four-hour candle, the price is heading towards the resistance (1.11916), the possibility of a rebound is possible, but by breaking it and closing higher with a four-hour candle, the price will head to the resistance area (1.12793 – 1.12918)
Support points: 1.08351 – 1.06322
Resistance points: 1.10949 – 1.11916
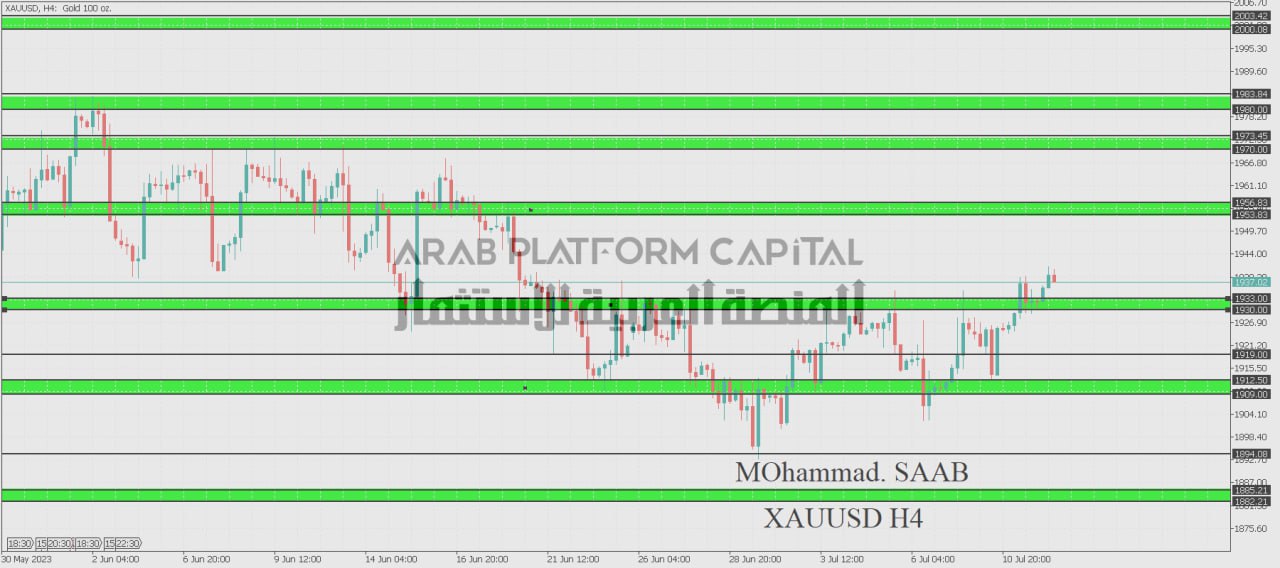
gold index:
The most important area (1930-1933) As long as the price is above the most important area, the price will head to the resistance area (1953-1956), the possibility of a rebound from it is possible, but by breaking it and closing higher with a four-hour candle, the price will head to the resistance area (1970-1973)
Alternative scenario:
The most important area (1930-1933), i.e. closing below the area (1930) with a four-hour candle, the price heads to the support area (1909-1912), the possibility of a rebound from it is possible, but by breaking it and closing below the four-hour candle, the price heads to the support area (1894), the possibility of a rebound from it is available But by breaking it and closing down with a four-hour candle, the price heads to the support area (1882-1885).
Support points: 1930 – 1909
Points of resistance: 1956 – 1973
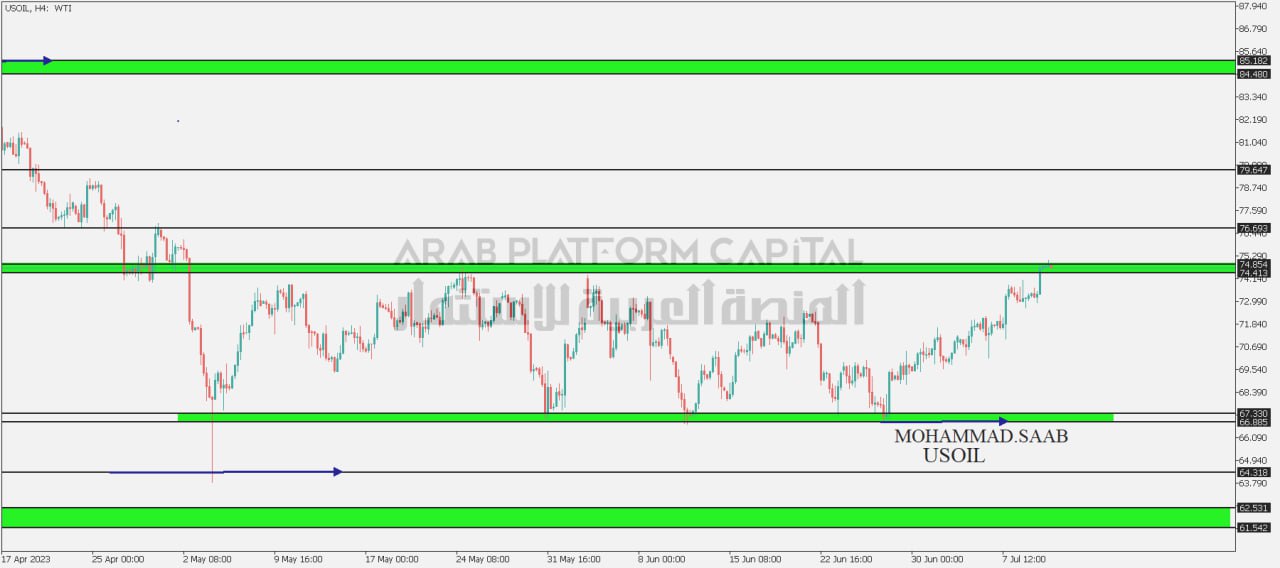
Oil indicator:
The most important area (74.413 – 74.854), i.e. breaking and closing below the area (74.413) with a four-hour candle, the price heads towards the support area (66.885 – 67.330), the possibility of a rebound from it is possible, but by breaking it and closing below with a four-hour candle, the price heads towards the support (64.318)
Alternative scenario:
The most important area (74.413 – 74.854), i.e. breaking and closing above the most important area with a four-hour candle, the price is heading towards the resistance (76.693), the possibility of a bounce from it is possible, but by breaking it and closing higher with a four-hour candle, the price is heading towards the resistance (79.647).
Support points: 66,885 – 64,318
Resistance points: 74.854 – 76.693
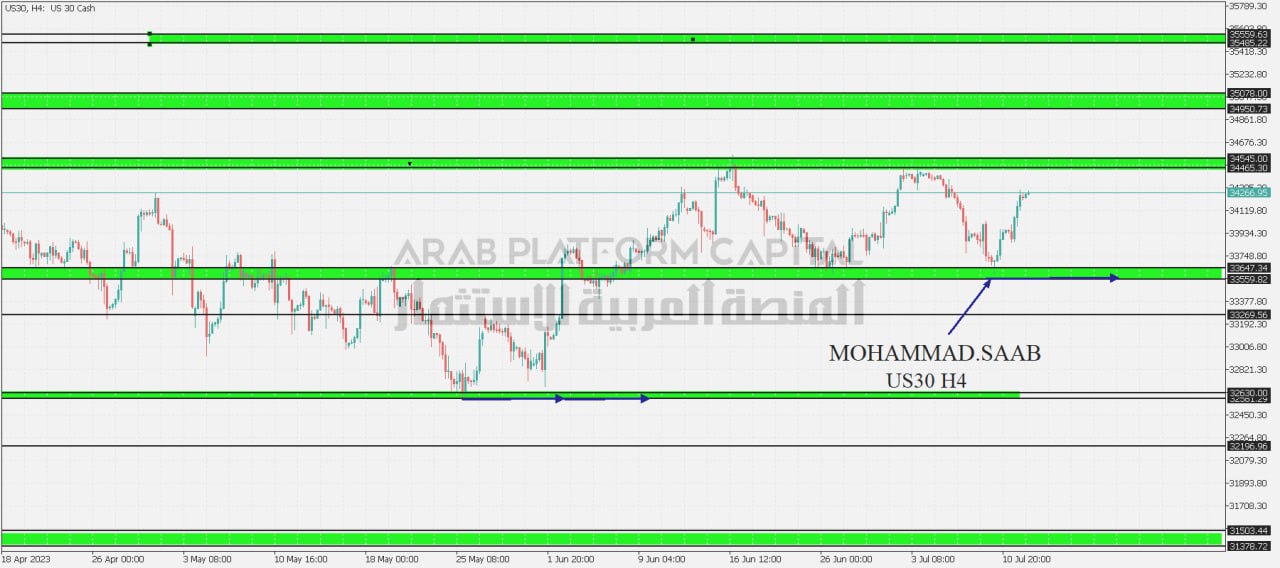
Dow Jones Index:
The most important area (33559 – 33647) as long as the price is above the most important area, the price heads to the resistance area (34465-34545), the possibility of a bounce from it is possible, but by breaking it and closing higher with a four-hour candle, the price heads to the resistance area (34950 – 35078)
Alternative scenario:
The most important area (33559 – 33647), i.e. breaking and closing below the area (33559) with a four-hour candle, the price heads to the support area (33269), the possibility of a rebound from it is possible, but by breaking it and closing down with a four-hour candle, the price heads to the support area (32581 – 32630).
Support points: 33559 – 33269
Resistance points: 34545 – 35078