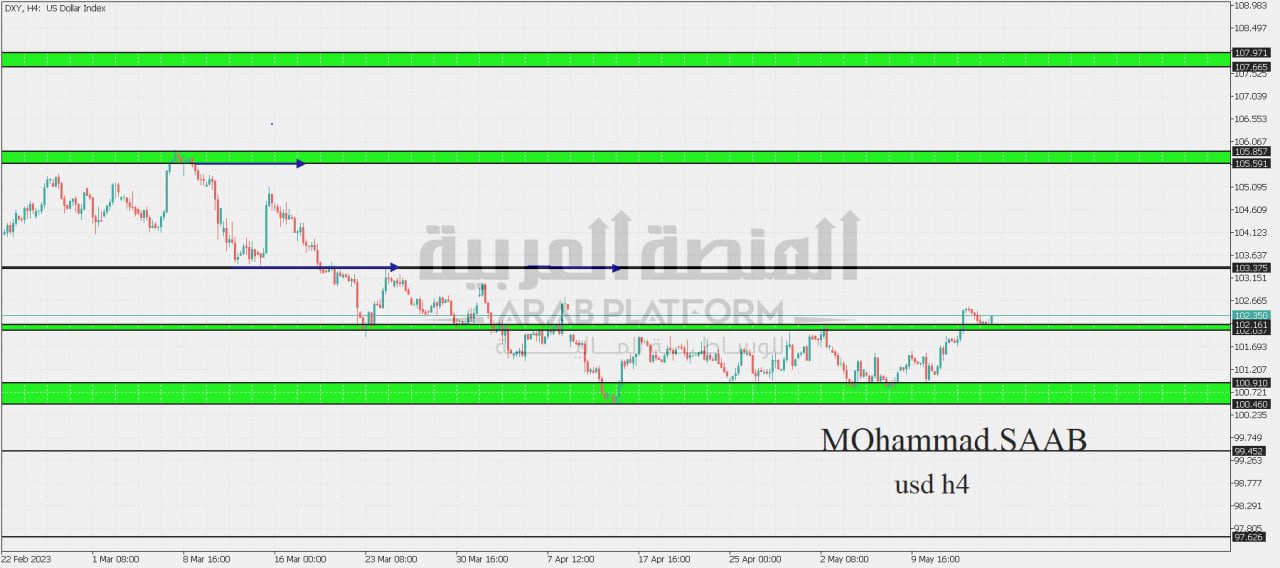
Dollar index analysis:
Kawasan paling penting (102,037 – 102,161) selagi harga berada di atas kawasan yang paling penting, harga menuju ke kawasan rintangan (103.375), kemungkinan lantunan daripadanya adalah mungkin, tetapi dengan menembusi dan menutup lebih tinggi dengan lilin empat jam, harga menuju ke arah kawasan rintangan (105.591 – 105.857).
Senario alternatif:
Kawasan paling penting (102,037 – 102,161), iaitu menutup dan mengukuh di bawah kawasan (102.037) dengan lilin empat jam, harga menuju ke kawasan sokongan (100.460 – 100.910), kemungkinan lantunan daripadanya adalah mungkin , tetapi dengan memecahkannya dan menutup di bawah dengan lilin empat jam, harga menuju ke kawasan sokongan (99.452)
Mata sokongan: 102,037 – 100,460
Mata rintangan: 103.375 – 105.857
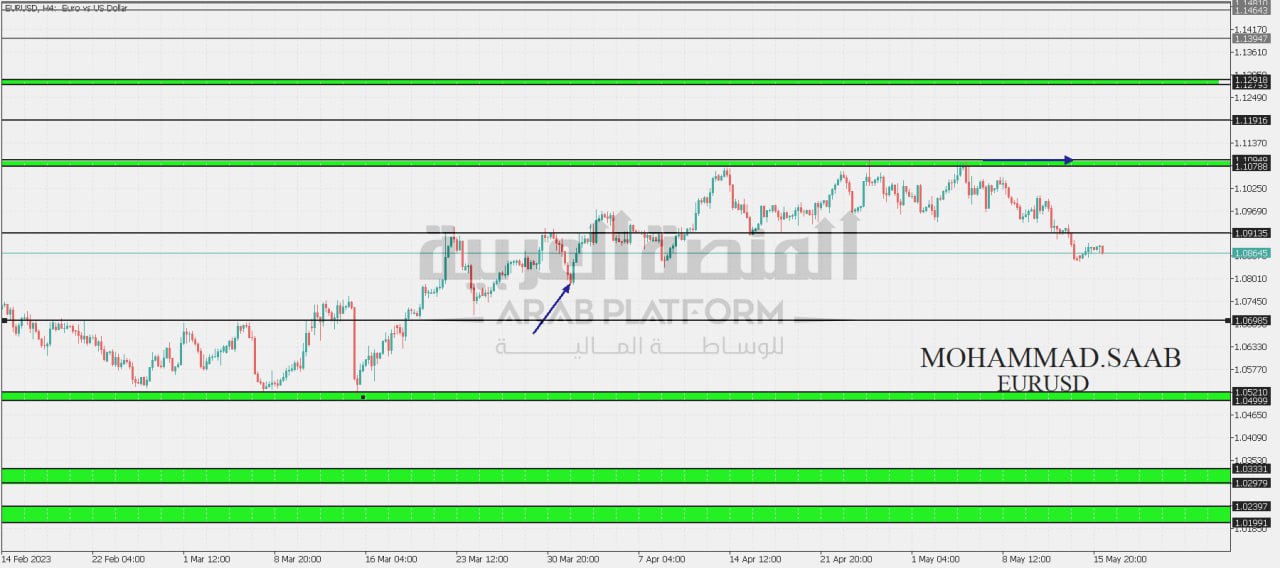
Analysis of the EURUSD pair:
The most important area (1.09135) As long as the price is below the most important area, the price will head to the support area (1.06985). The possibility of a bounce is possible, but by breaking it and closing down with a four-hour candle, the price will head to the support area (1.04999 – 1.05210).
Senario alternatif:
The most important area is (1.09135), the possibility of a retracement is possible, but by breaking it and closing higher with a four-hour candle, the price will head towards the resistance area (1.10788 – 1.10949).
Mata sokongan: 1.06985 – 1.04999
Resistance points: 1.09135 – 1.10949
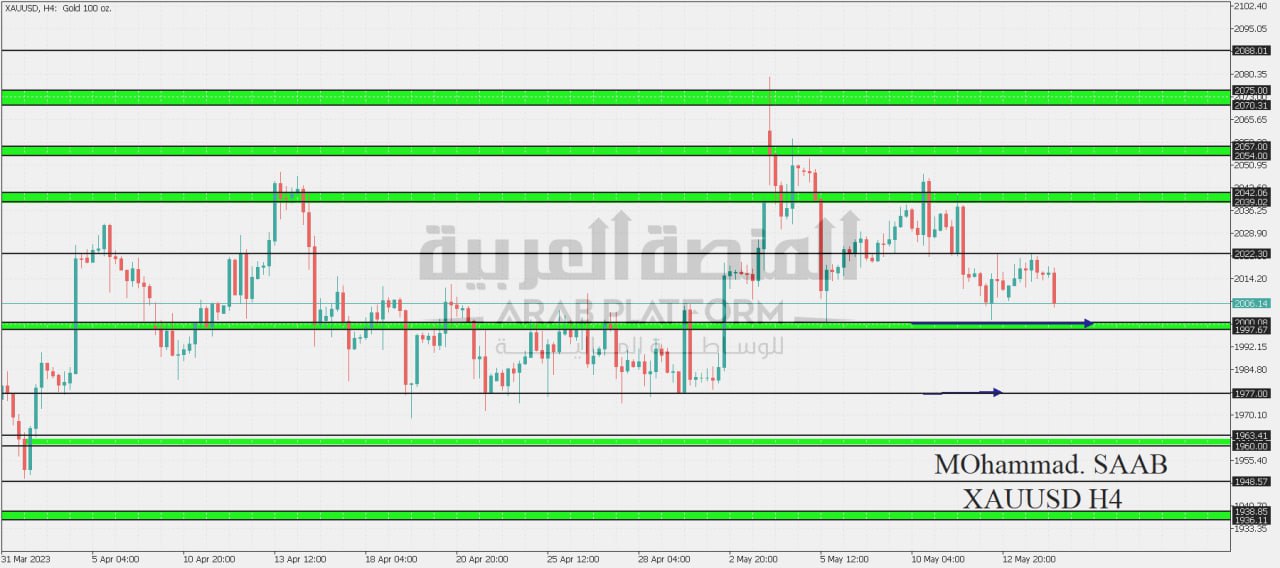
indeks emas:
The most important area (1997-2000), i.e. breaking and closing below the area (1997) with a four-hour candle, the price heads to the support area (1977), the possibility of a rebound from it is possible, but by breaking it and closing below the four-hour candle, the price heads to the support area (1960-1963)
Senario alternatif:
The most important area (1997-2000) stability and price closing above the most important area with a four-hour candle, the price is heading to the resistance area (2022), the possibility of a bounce from it is possible, but by breaking it and closing higher by a four-hour candle, the price is heading to the resistance area (2039-2042), the possibility of a rebound from it is possible But by breaking it and closing higher with a four-hour candle, the price heads to the resistance area (2054 – 2057).
Support points: 1997 – 1977
Points of resistance: 2022 – 2042
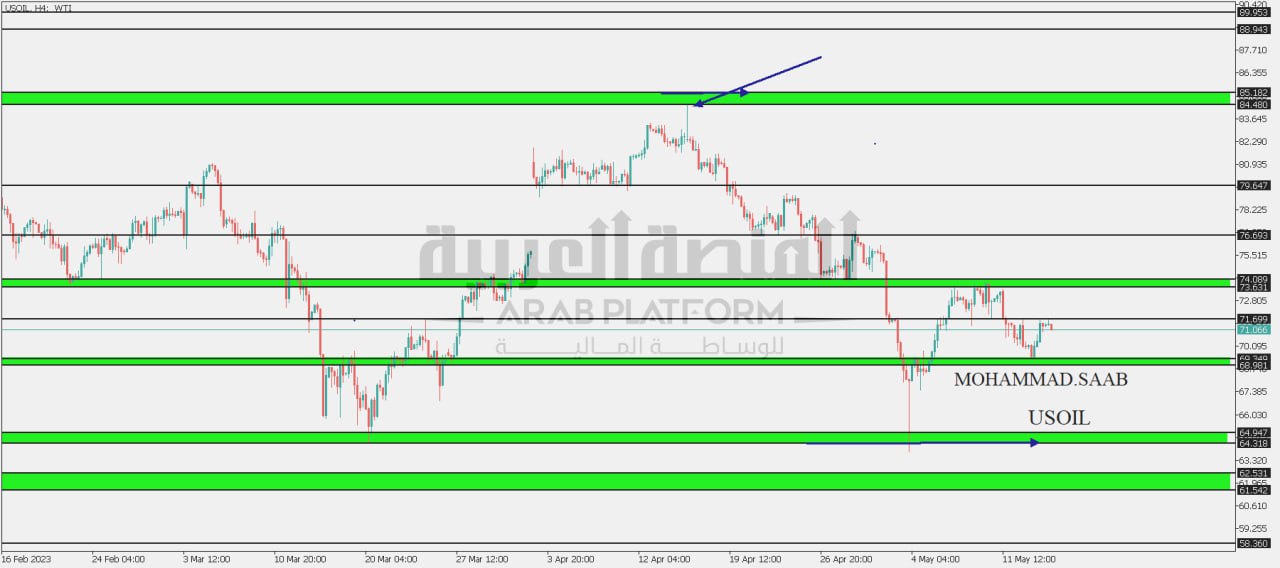
Oil:
The most important area (71.699), as long as the price is below the most important area, the price will head to the support area (68.981 – 69.349). The possibility of a rebound from it is possible, but by breaking it and closing down with a four-hour candle, the price will head to the support (64.318 – 64.947).
Senario alternatif:
The most important area (71.699), i.e. closing and holding above the most important area with a four-hour candle, the price heads towards the resistance area (73.631 – 74.089), the possibility of a bounce from it is possible, but by breaking it and closing higher with a four-hour candle, the price heads towards the resistance (76.693), the possibility of a bounce from it is possible, but by breaking it And a higher closing with a four-hour candle, the price is heading towards the resistance (79.647).
Mata sokongan: 68,981 – 64,318
Resistance points: 71.699 – 74.089
Dow Jones index analysis:
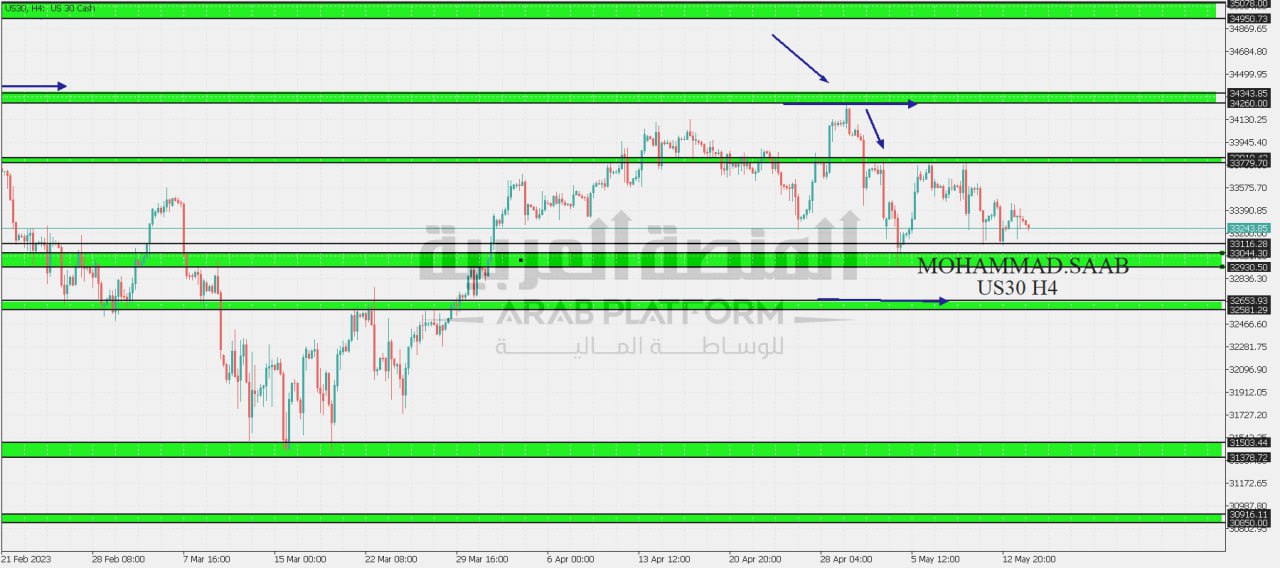
The most important area is (33116), the possibility of a bounce from it is possible, but by breaking it and closing down with a four-hour candle, the price will head to the support area (32930 – 33044). A bounce from it is possible, but by breaking it and closing down with a four-hour candle, the price will head to the support area (31378 – 31503).
Senario alternatif:
The most important area (33116) price stability above the most important area with a four-hour candle, the price is heading to the resistance area (33779 – 33810), the possibility of a rebound from it is possible, but by breaking it and closing higher with a four-hour candle, the price is heading to the resistance area (34260 – 34343)
Support points: 33116 – 32930
Resistance points: 33810 – 34343
NASDAQ analysis:
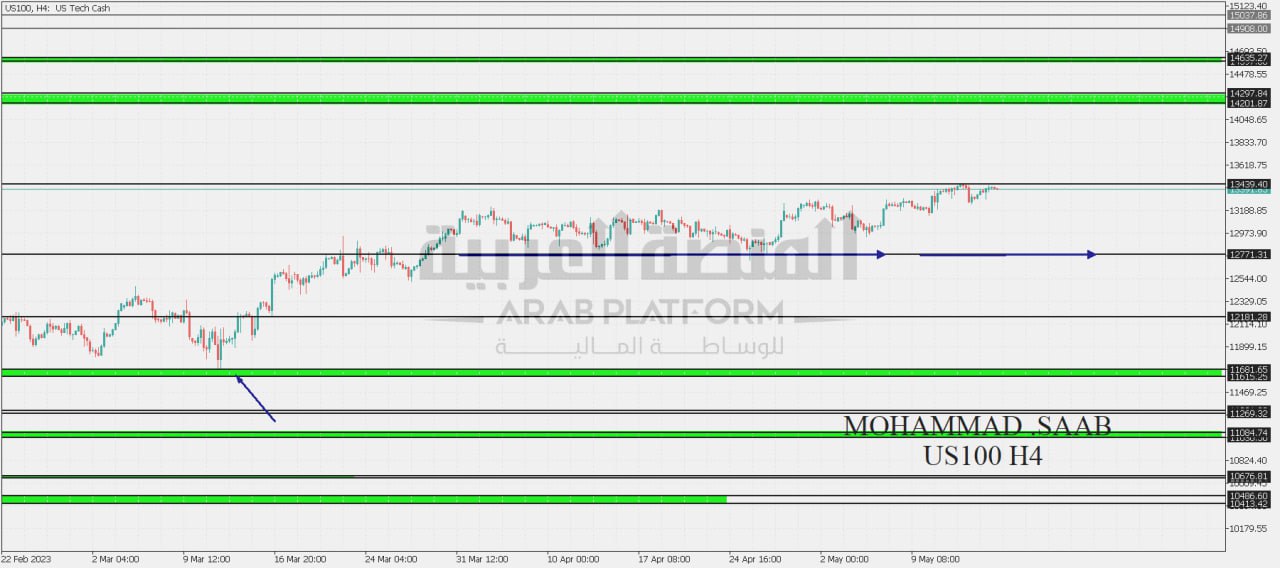
The most important area (13439), i.e. consolidation and closing below the most important area with a four-hour candle, the price is heading to the support area (12771), the possibility of a rebound is possible, but by breaking it and closing below the four-hour candle, the price is heading to the support (12181)
Senario alternatif:
The most important area (13430), i.e. breaking and closing higher. The most important area with a four-hour candle, the price heads towards the resistance (14201 – 14297). The possibility of a bounce is possible, but by breaking it and closing higher with a four-hour candle, the price heads towards the resistance (14201 – 14297).
Titik sokongan: 12771 – 12181
Resistance points: 13439 – 14297

