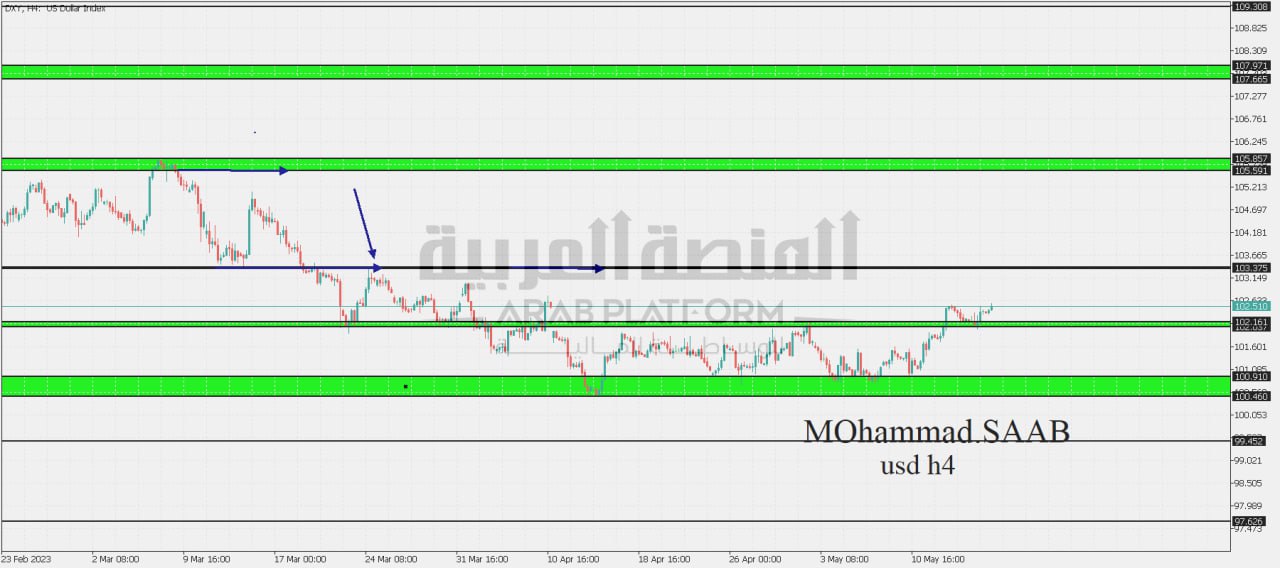
indice du dollar :
The most important area (102,037 – 102,161) as long as the price is above the most important area, the price heads towards the resistance area (103.375), the possibility of a bounce from it is possible, but by breaking it and closing higher with a four-hour candle, the price heads towards the resistance area (105.591 – 105.857).
Scénario alternatif :
The most important area (102,037 – 102,161), i.e. closing and consolidating below the area (102.037) with a four-hour candle, the price is heading to the support area (100.460 – 100.910), the possibility of a rebound from it is possible, but by breaking it and closing below with a four-hour candle, the price is heading to the support area (99.452)
Support points: 102,037 – 100,460
Resistance points: 103.375 – 105.857
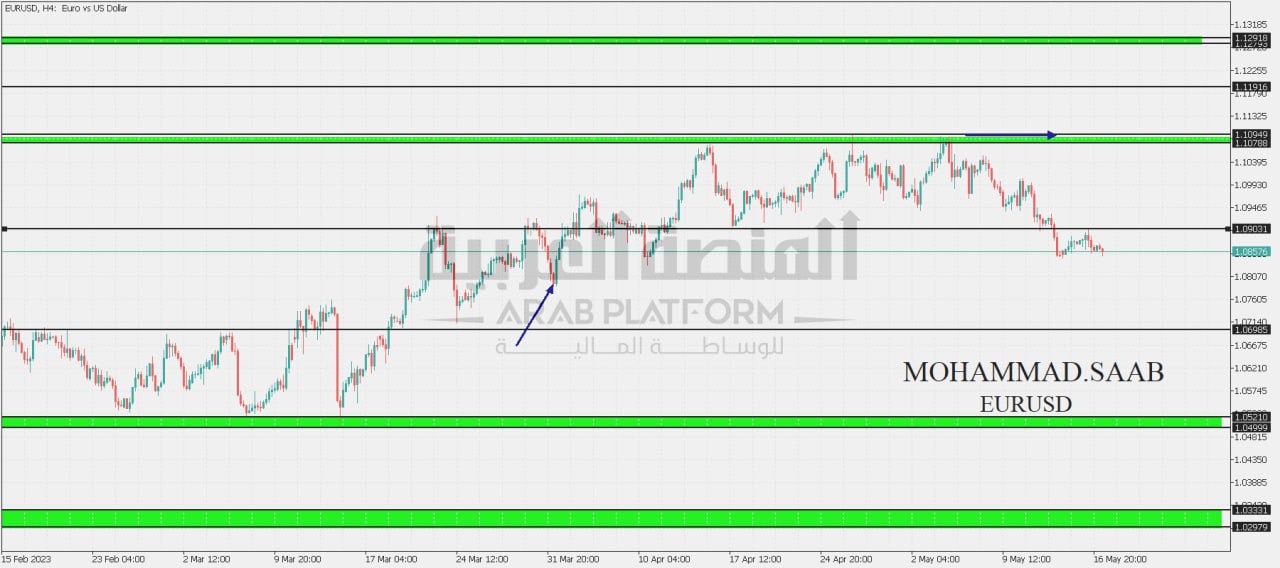
Indicateur de paire eurodollar :
The most important area (1.09031) As long as the price is below the most important area, the price will head to the support area (1.06985). The possibility of a bounce is possible, but by breaking it and closing down with a four-hour candle, the price will head to the support area (1.04999 – 1.05210).
Scénario alternatif :
The most important area (1.09031) the possibility of a retracement is possible, but by breaking it and closing higher with a four-hour candle, the price will head to the resistance area (1.10788 – 1.10949).
Support points: 1.06985 – 1.04999
Resistance points: 1.09031 – 1.10949
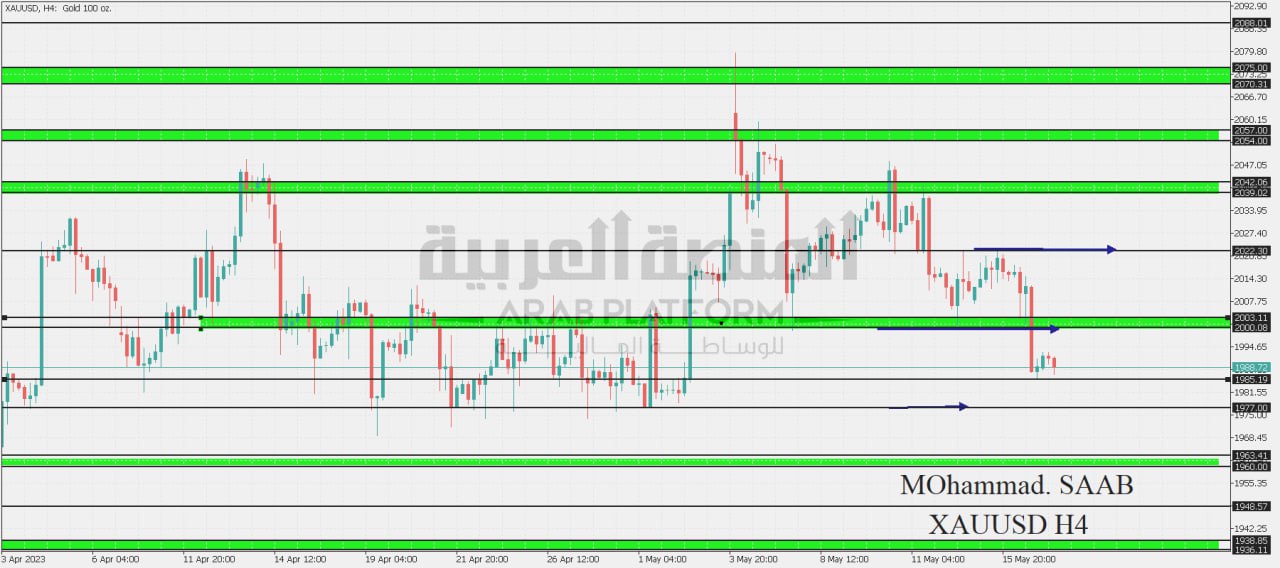
indice or :
The most important area (2000 – 2003) as long as the price is heading to the support area (1985) The possibility of a rebound from it is possible, but by breaking it and closing down with a four-hour candle, the price heads to the support area (1977) The possibility of a rebound from it is possible, but by breaking it and closing below with a four-hour candle, the price heads to Support Zone ( 1960 – 1963 )
Scénario alternatif :
The most important area (2000 – 2003) i.e. the closing and stability of the price above the area (2003) with a four-hour candlestick, the price heads to the resistance area (2022), the possibility of a rebound from it is possible, but by breaking it and closing higher with the four-hour candlestick, the price heads to the resistance area (2039-2042) Possibility A bounce from it is possible, but by breaking it and closing higher with a four-hour candle, the price is heading to the resistance area (2054-2057)
Support points: 1985 – 1977
Points of resistance: 2003 – 2022
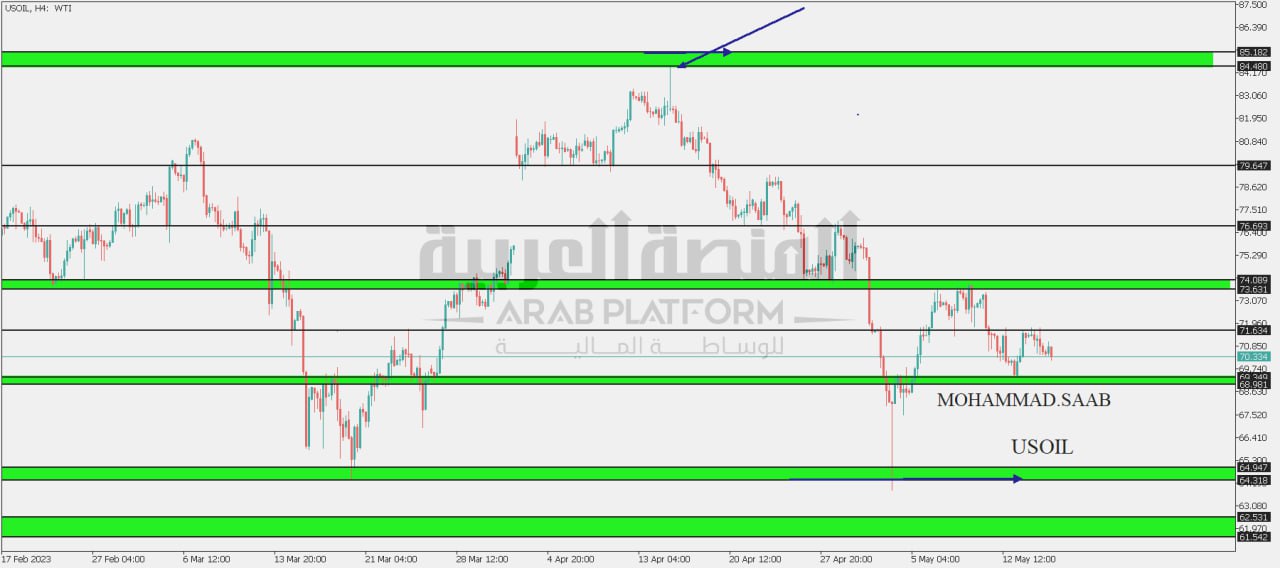
Indicateur d'huile :
The most important area (71.634), as long as the price is below the most important area, the price will head to the support area (68.981 – 69.349). The possibility of a bounce from it is possible, but by breaking it and closing down with a four-hour candle, the price will head to the support (64.318 – 64.947).
Scénario alternatif :
The most important area (71.634), i.e. closing and holding above the most important area with a four-hour candle, the price heads towards the resistance area (73.631 – 74.089), the possibility of a bounce from it is possible, but by breaking it and closing higher with a four-hour candle, the price heads towards the resistance (76.693), the possibility of a bounce from it is possible, but by breaking it And a higher closing with a four-hour candle, the price is heading towards the resistance (79.647).
Support points: 68,981 – 64,318
Resistance points: 71.634 – 74.089
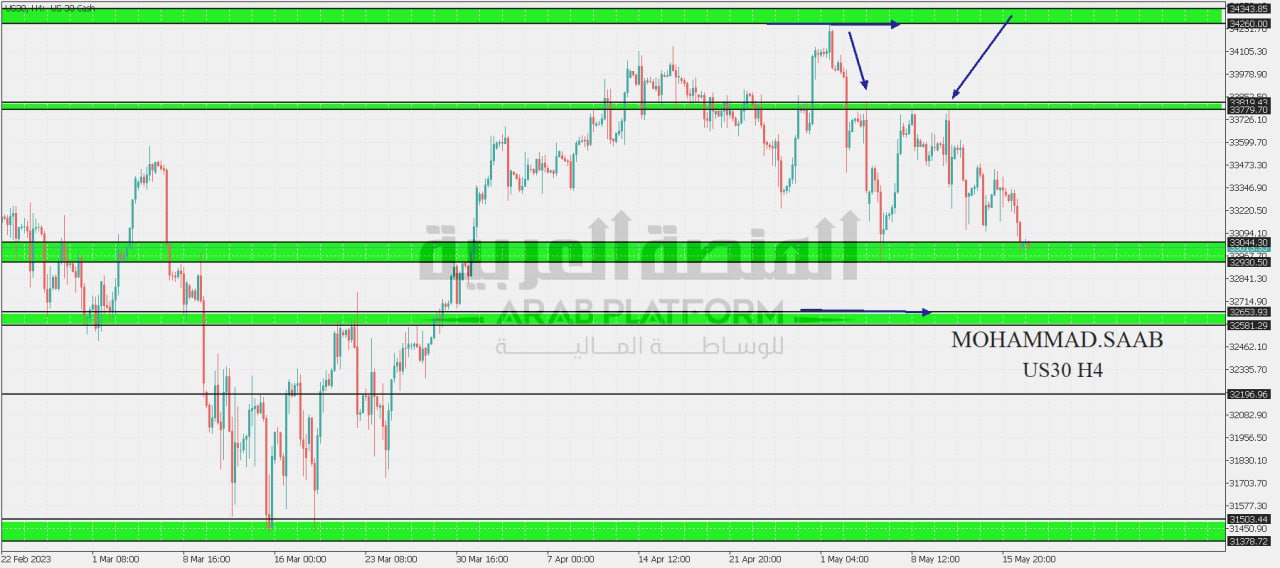
Indice Dow Jones :
The most important area (32930 – 33044), i.e. closing and consolidating below the area (32930) with a four-hour candle, the price heads to the support area (32581 – 32653), the possibility of a rebound from it is possible, but by breaking it and closing below with a four-hour candle, the price heads to the support area (32196).
Scénario alternatif :
The most important area (32930 – 33044) price stability above the most important area with a four-hour candle, the price heads towards the resistance area (33779 – 33810) the possibility of a bounce from it is possible, but by breaking it and closing higher with a four-hour candle, the price heads towards the resistance area (34260 – 34343)
Support points: 32930 – 32581
Resistance points: 33044 – 33819
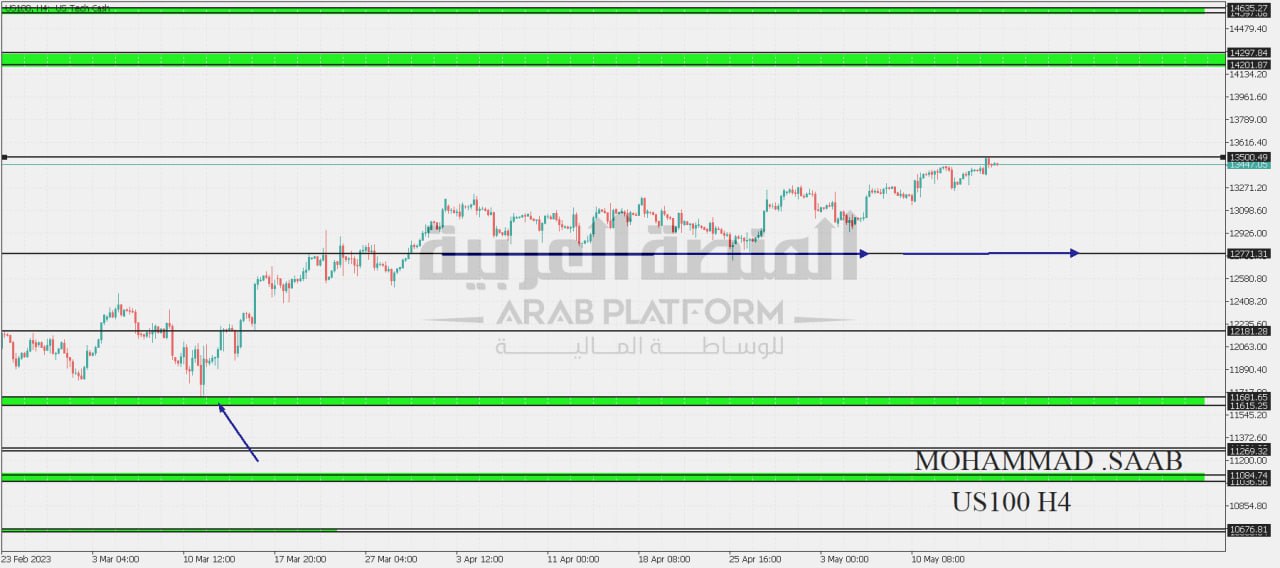
NASDAQ :
The most important area (13500), i.e. stability and closing below the resistance area with a four-hour candle, the price is heading to the support area (12771), the possibility of a bounce is possible, but by breaking it and closing below the four-hour candle, the price is heading to the support (12181)
Scénario alternatif :
The most important area (13500), i.e. breaking and closing higher. The most important area with a four-hour candle, the price heads towards the resistance (14201 – 14297). The possibility of a bounce is possible, but by breaking it and closing higher with a four-hour candle, the price heads towards the resistance (14597 – 14635).
Support points: 12771 – 12181
Resistance points: 13500 – 14297

