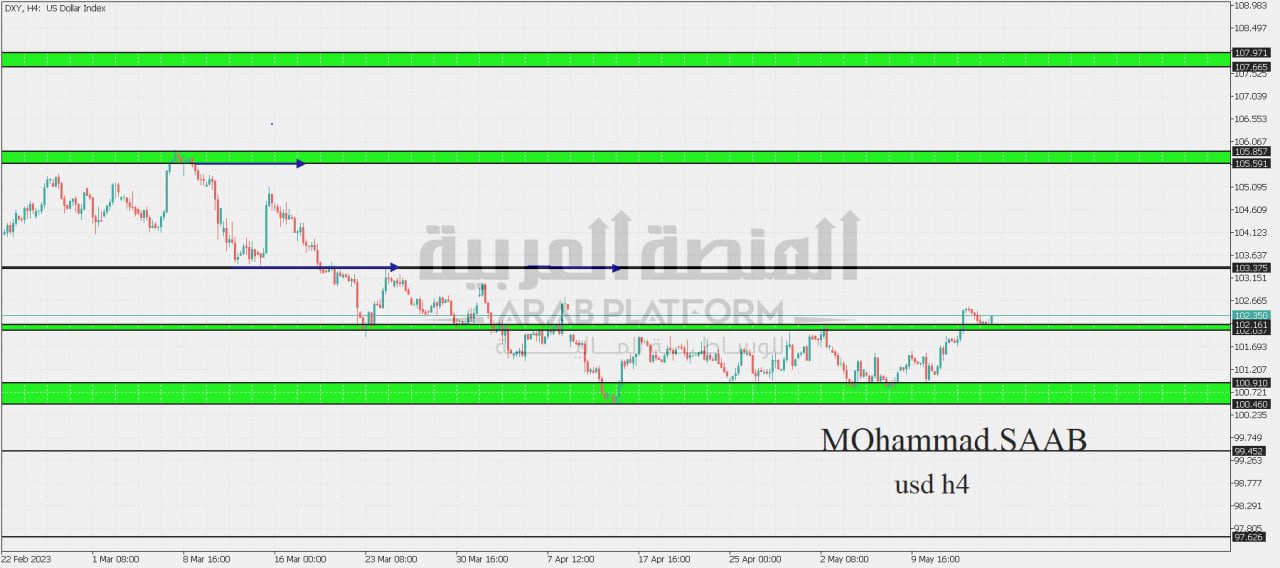
Dollar index analysis:
The most important area (102,037 – 102,161) as long as the price is above the most important area, the price heads towards the resistance area (103.375), the possibility of a bounce from it is possible, but by breaking it and closing higher with a four-hour candle, the price heads towards the resistance area (105.591 – 105.857).
Scénario alternatif :
The most important area (102,037 – 102,161), i.e. closing and consolidating below the area (102.037) with a four-hour candle, the price is heading to the support area (100.460 – 100.910), the possibility of a rebound from it is possible, but by breaking it and closing below with a four-hour candle, the price is heading to the support area (99.452)
Support points: 102,037 – 100,460
Resistance points: 103.375 – 105.857
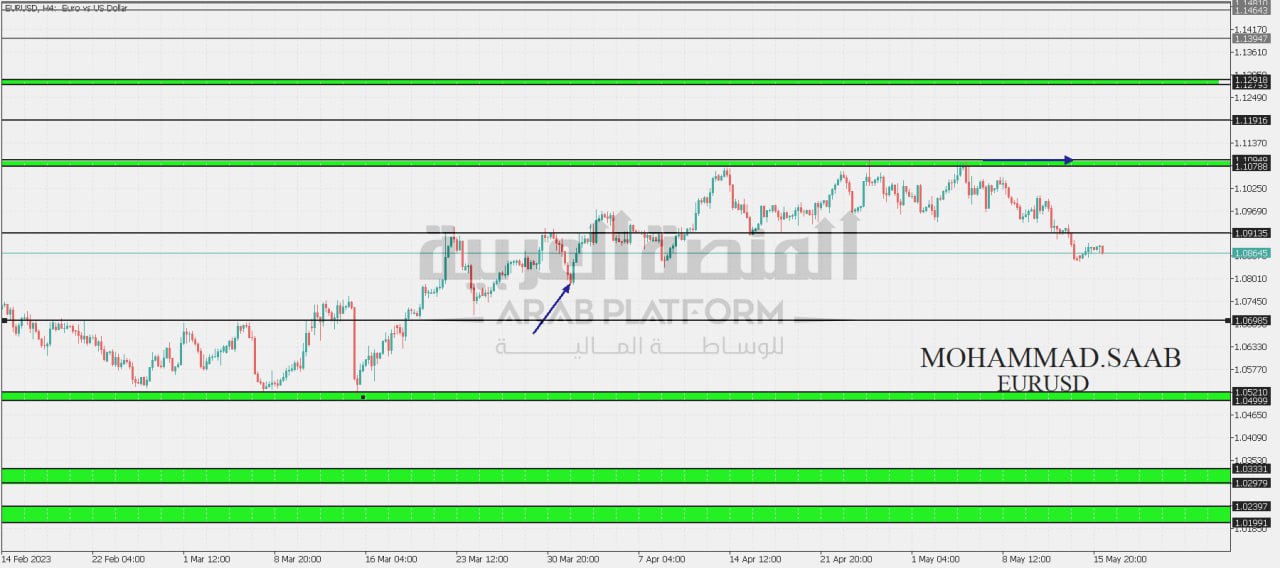
Analysis of the EURUSD pair:
The most important area (1.09135) As long as the price is below the most important area, the price will head to the support area (1.06985). The possibility of a bounce is possible, but by breaking it and closing down with a four-hour candle, the price will head to the support area (1.04999 – 1.05210).
Scénario alternatif :
The most important area is (1.09135), the possibility of a retracement is possible, but by breaking it and closing higher with a four-hour candle, the price will head towards the resistance area (1.10788 – 1.10949).
Support points: 1.06985 – 1.04999
Resistance points: 1.09135 – 1.10949
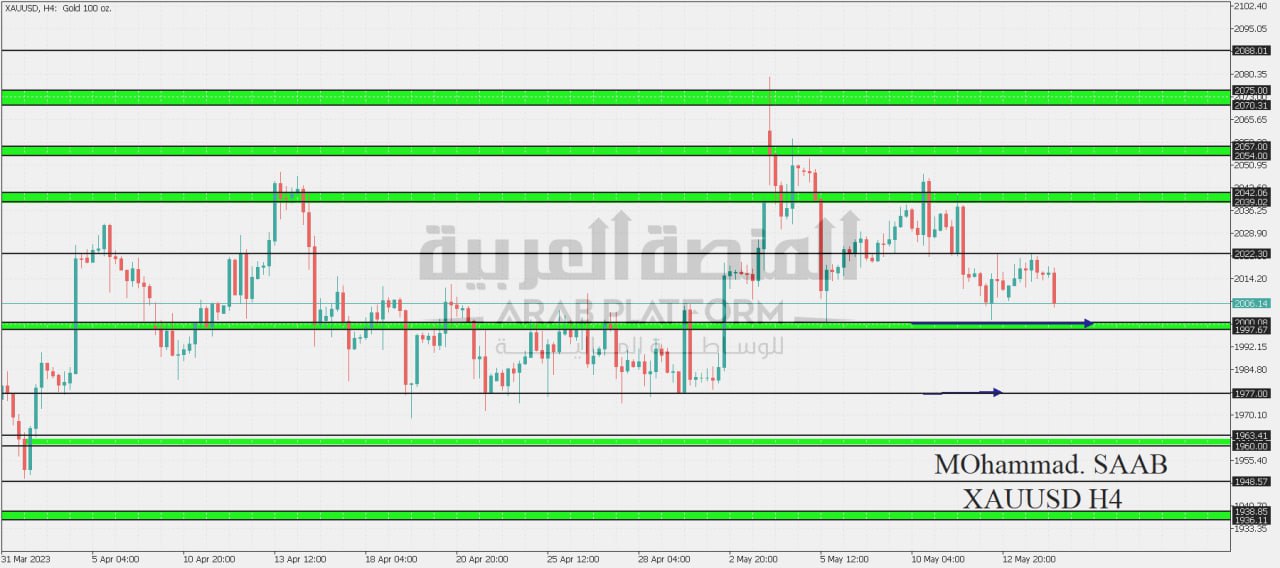
indice or :
The most important area (1997-2000), i.e. breaking and closing below the area (1997) with a four-hour candle, the price heads to the support area (1977), the possibility of a rebound from it is possible, but by breaking it and closing below the four-hour candle, the price heads to the support area (1960-1963)
Scénario alternatif :
The most important area (1997-2000) stability and price closing above the most important area with a four-hour candle, the price is heading to the resistance area (2022), the possibility of a bounce from it is possible, but by breaking it and closing higher by a four-hour candle, the price is heading to the resistance area (2039-2042), the possibility of a rebound from it is possible But by breaking it and closing higher with a four-hour candle, the price heads to the resistance area (2054 – 2057).
Support points: 1997 – 1977
Points of resistance: 2022 – 2042
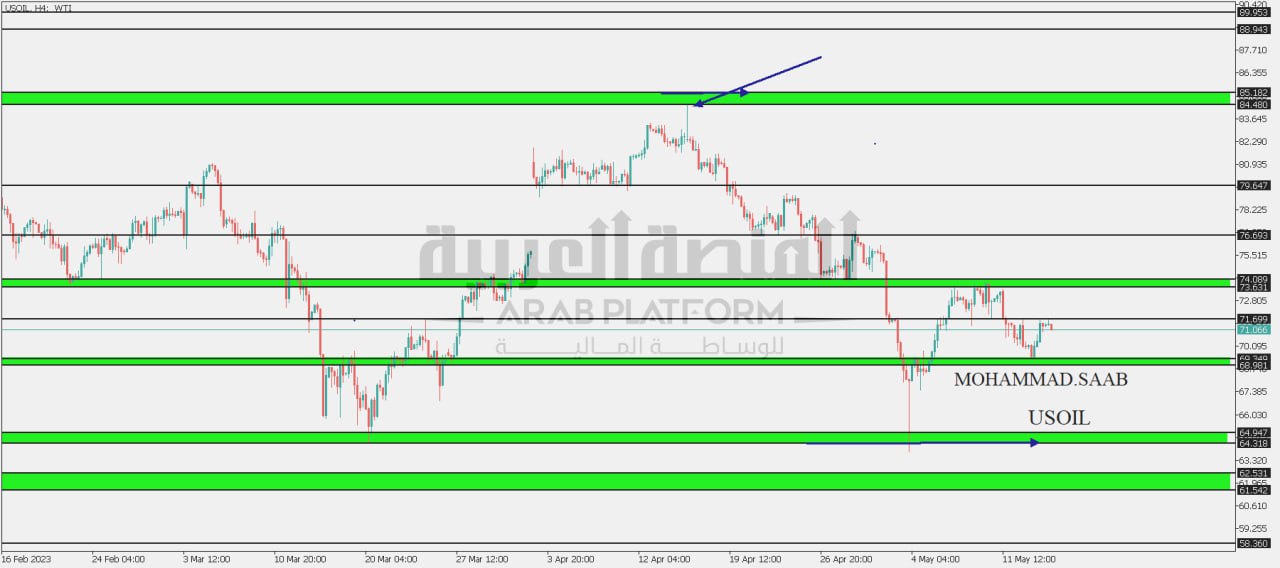
Oil:
The most important area (71.699), as long as the price is below the most important area, the price will head to the support area (68.981 – 69.349). The possibility of a rebound from it is possible, but by breaking it and closing down with a four-hour candle, the price will head to the support (64.318 – 64.947).
Scénario alternatif :
The most important area (71.699), i.e. closing and holding above the most important area with a four-hour candle, the price heads towards the resistance area (73.631 – 74.089), the possibility of a bounce from it is possible, but by breaking it and closing higher with a four-hour candle, the price heads towards the resistance (76.693), the possibility of a bounce from it is possible, but by breaking it And a higher closing with a four-hour candle, the price is heading towards the resistance (79.647).
Support points: 68,981 – 64,318
Resistance points: 71.699 – 74.089
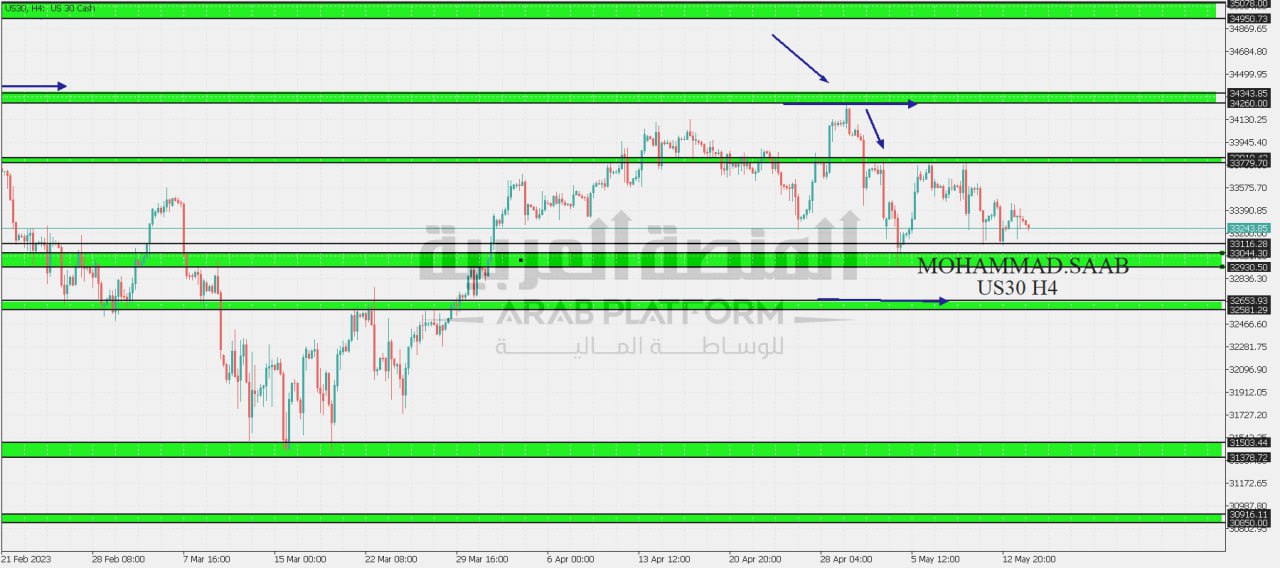
Dow Jones index analysis:
The most important area is (33116), the possibility of a bounce from it is possible, but by breaking it and closing down with a four-hour candle, the price will head to the support area (32930 – 33044). A bounce from it is possible, but by breaking it and closing down with a four-hour candle, the price will head to the support area (31378 – 31503).
Scénario alternatif :
The most important area (33116) price stability above the most important area with a four-hour candle, the price is heading to the resistance area (33779 – 33810), the possibility of a rebound from it is possible, but by breaking it and closing higher with a four-hour candle, the price is heading to the resistance area (34260 – 34343)
Support points: 33116 – 32930
Resistance points: 33810 – 34343
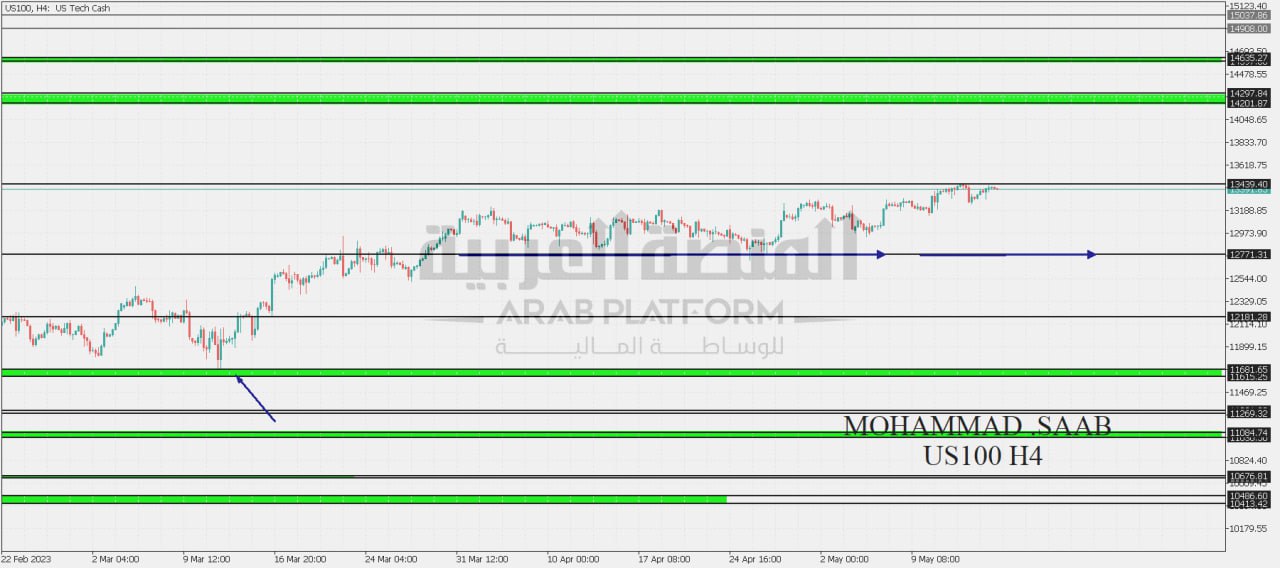
NASDAQ analysis:
The most important area (13439), i.e. consolidation and closing below the most important area with a four-hour candle, the price is heading to the support area (12771), the possibility of a rebound is possible, but by breaking it and closing below the four-hour candle, the price is heading to the support (12181)
Scénario alternatif :
The most important area (13430), i.e. breaking and closing higher. The most important area with a four-hour candle, the price heads towards the resistance (14201 – 14297). The possibility of a bounce is possible, but by breaking it and closing higher with a four-hour candle, the price heads towards the resistance (14201 – 14297).
Support points: 12771 – 12181
Resistance points: 13439 – 14297

