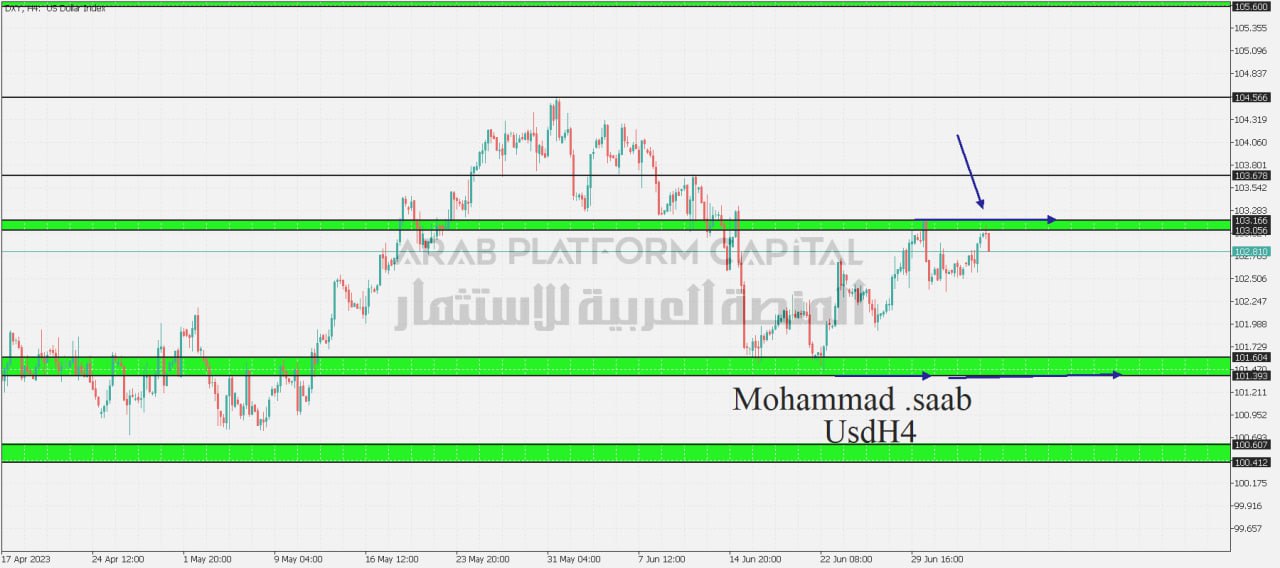
índice del dólar:
The most important area (103.05 – 103.166) Price stability below the most important area The price is heading to the support area (101.393 – 101.604) The possibility of a bounce from it is possible, but by breaking it and closing down with a four-hour candle, the price will head to the support area (100.412 – 100.607)
Escenario alternativo:
The most important area (103.056 – 103.166) Any break and higher closing with a four-hour candle leads the price to the resistance area (103.678) The possibility of a rebound from it is possible, but by breaking it and closing higher with a four-hour candle, the price heads to the resistance area (104.566)
Support points: 101,393 – 100,412
Resistance points: 103.166 – 103.678
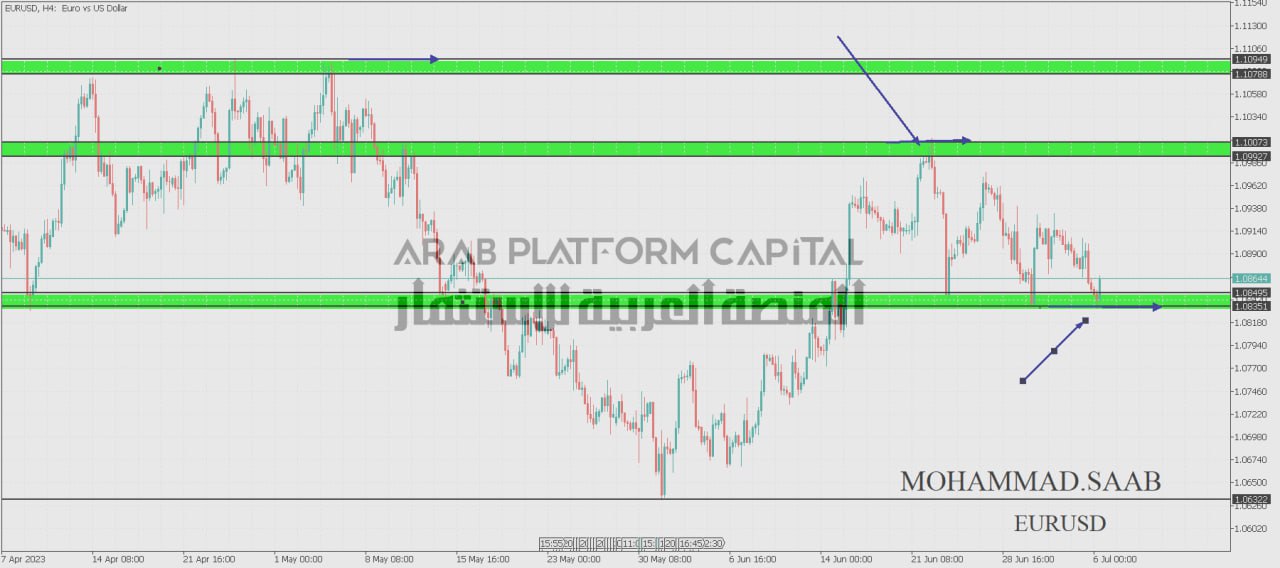
Indicador de par de eurodólares:
The most important area (1.08351 – 1.08495) The price is stable above the most important area, the price is heading to the resistance (1.09927 – 1.10073) The possibility of a rebound is possible, but by breaking it and closing higher with a four-hour candle, the price is heading to the resistance area (1.10788 – 1.10949)
Escenario alternativo:
The most important area (1.08351 – 1.08495), i.e. breaking and closing below the most important area with a four-hour candle, the price will head to the support area (1.06322), the possibility of a bounce is possible, but by breaking it and closing below with a four-hour candle, the price will head to the support area (1.04999 – 1.05210)
Support points: 1.08351 – 1.06322
Resistance points: 1.10073- 1.10949
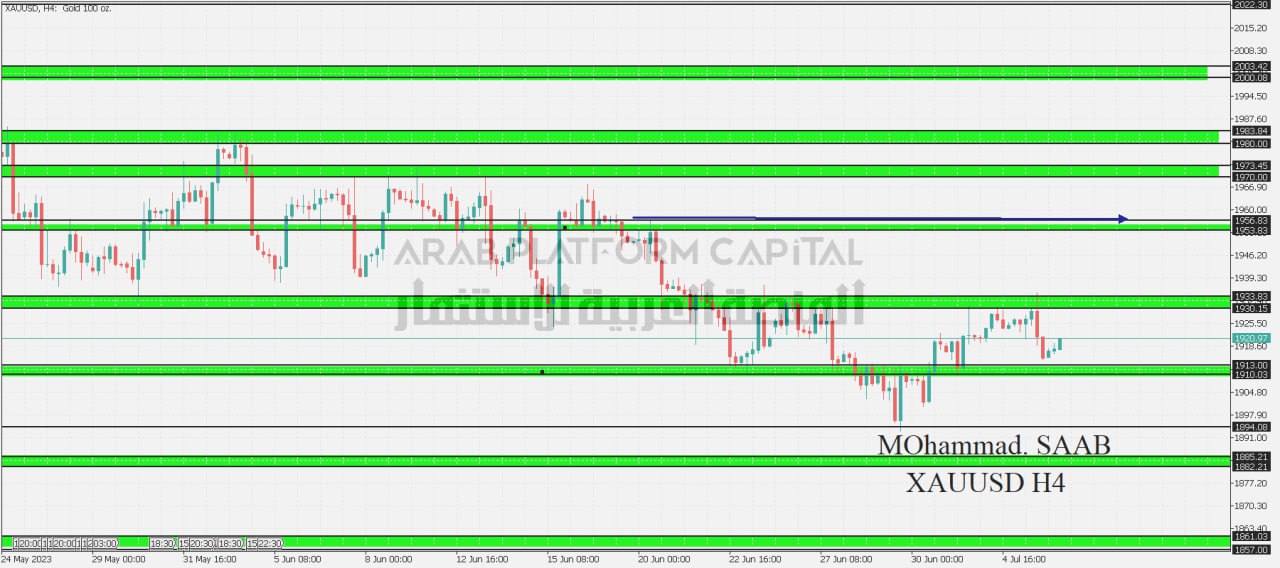
índice de oro:
The most important area (1910 – 1913) as long as the price is above the most important area, the price is heading to the resistance area (1930 – 1933) the possibility of a rebound from it is possible, but by breaking it and closing higher with a four-hour candle, the price is heading to the resistance area (1953 – 1956) the possibility of a rebound from it is possible, but by breaking it and closing Higher with four hour candle the price is heading to the resistance area (1970 – 1973)
Escenario alternativo:
The most important area (1910 – 1913), i.e. breaking and closing below the area (1910) with a four-hour candle, the price heads to the support area (1894), the possibility of a rebound from it is possible, but by breaking it and closing below the four-hour candle, the price heads to the support area (1882-1885)
Support points: 1910 – 1894
Points of resistance: 1933 – 1956
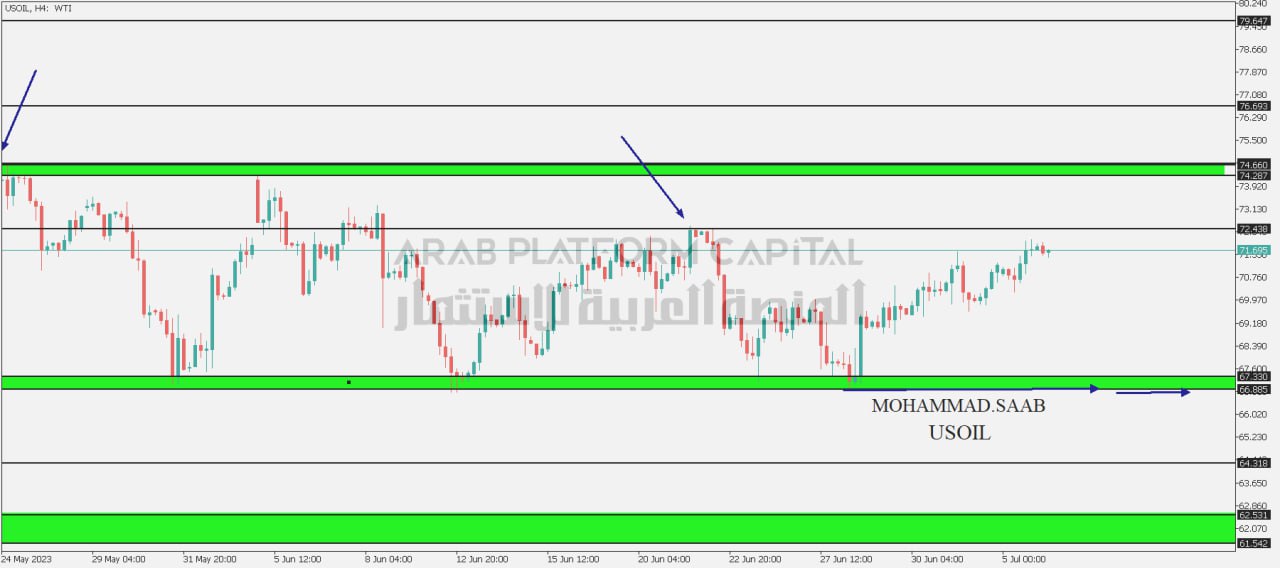
Indicador de aceite:
The most important area (66.886 – 67.330) as long as the price is above the most important area, the price will head towards the resistance area (72.438), the possibility of a bounce from it is possible, but by breaking it and closing higher with a four-hour candle, the price will head towards the resistance (74.287 – 74.673)
Escenario alternativo:
The most important area (66.886 – 67.330) the possibility of a rebound from it is possible, but by breaking it and closing down with a four-hour candle, the price is heading towards the support (64.318)
Support points: 66,886 – 64,318
Resistance points: 72.438 – 74.660
Índice Dow Jones:
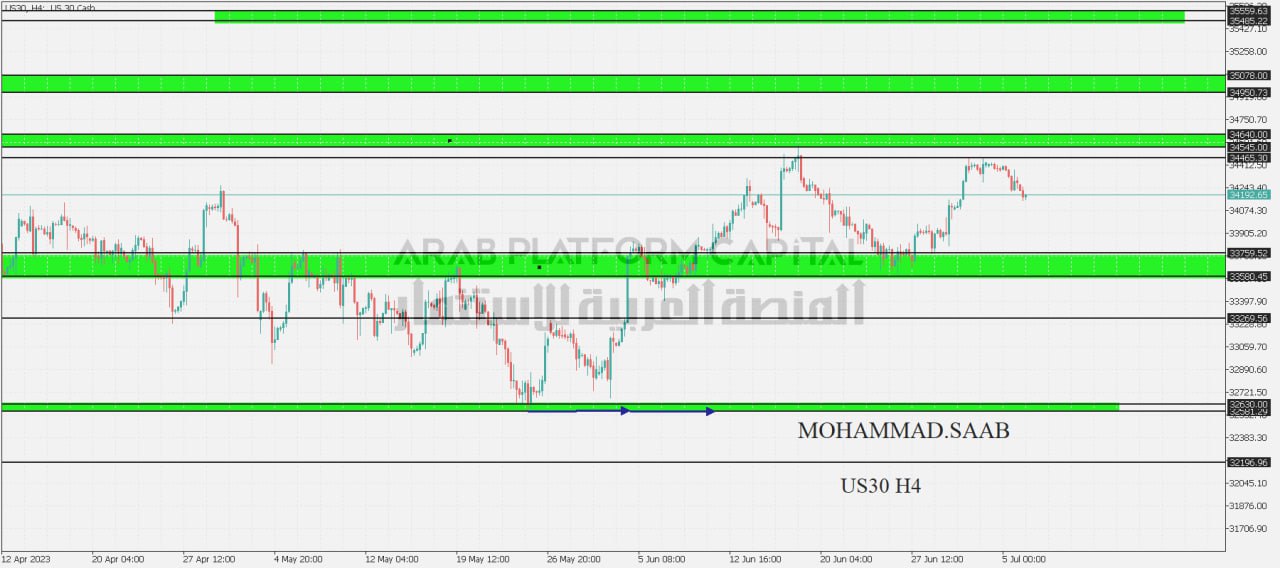
The most important area (34465) price stability below the most important area, the price heads to the support area (33580 – 33759) the possibility of a bounce from it is possible, but by breaking it and closing down with a four-hour candle, the price heads to the support area (33269) the possibility of a bounce from it is possible, but by breaking it and closing down with a four-hour candle The price is heading to the support area (32581 – 32630).
Escenario alternativo:
The most important area (34465), i.e. breaking and closing above the most important area with a four-hour candle, the price heads towards the resistance area (34545 – 34640), the possibility of a rebound from it is possible, but by breaking it and closing higher with a four-hour candle, the price heads towards the resistance area (34950 – 35078), the possibility of a bounce from it is possible, but By breaking it and closing higher with a four-hour candle, the price will head to the resistance area (35485 – 35559)
Support points: 33580 – 33269
Resistance points: 34465 – 34640
NASDAQ:
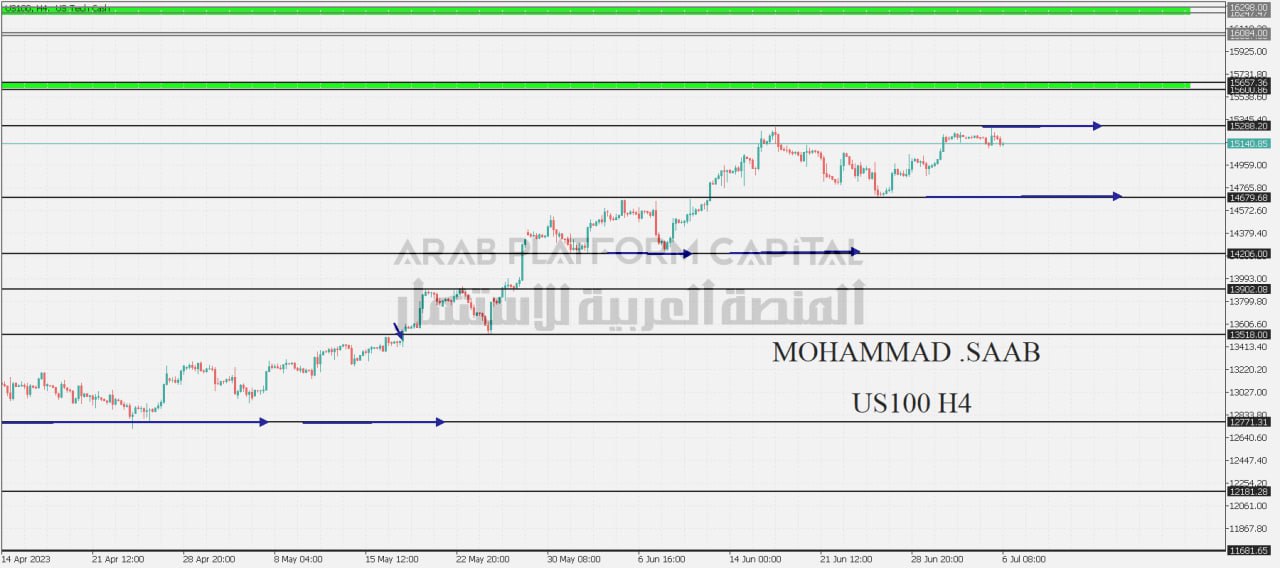
The most important area (15288) price stability below the most important area, the price heads to the support area (14679) the possibility of a rebound is possible, but by breaking it and closing down with a four-hour candle, the price heads towards support (14206) the possibility of a bounce is possible, but by breaking it and closing down with a four-hour candle, the price heads to support ( 13902) The possibility of a rebound is possible, but by breaking it and closing down with a four-hour candle, the price will head towards the support (13518)
Escenario alternativo:
The most important area (15288), i.e. breaking and closing above the most important area with a four-hour candle, the price will head towards the resistance (15600 – 15657). The possibility of a rebound is possible, but by breaking it and closing higher with a four-hour candle, the price will head towards the resistance (16030 – 16084)
Support points: 14679 – 14206
Resistance points: 15288 – 15657




ما هو اقل ايداع لديكم ؟ و ما هي قيمة العمولة عند السحب