Hello Traders
Today will make an update about NASDAQ futures
Nasdaq outperformed US indices with 24% year to date, a stark contrast to 0.16% of the narrowly Dow Jones over the period. Nasdaq even outperformed SNP500, which is supposed to be the leading index in the market.
Nasdaq massive rally for two weeks in a row was highly supported by AI technology. Nvidia giant tech company recorded almost 1 trillion dollars last week, becoming 6th largest company in the world.
In my opinion AI can be a copycat of early 1990’s .com bubble, that can be then next big thing.
1- Taiwan is the biggest chip producer
2- AI will swallow the chip market
3- Tension will increase between USA and China about Taiwan and might escalate to create a shortage in chip market.
4- All companies adapting AI technology will sky rocket.
5- AI is a more magnified bubble compared to .com in 1993 up to 1998.
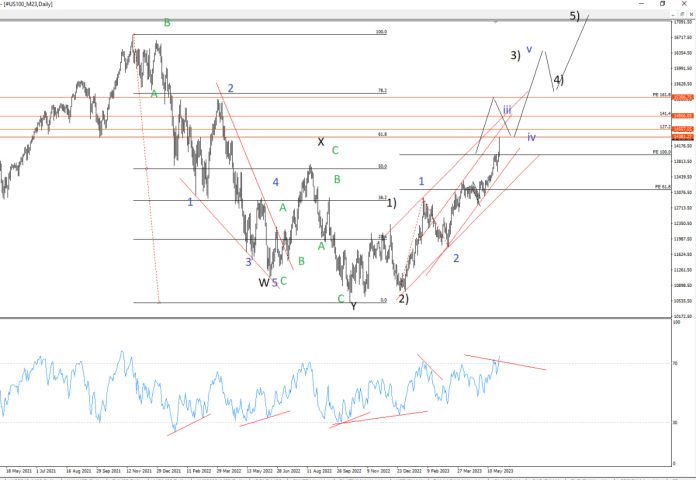
So now that we have established the main fundamental that can push Nasdaq to all time highs, to 18500 first target 1.272% should we break 16750 2021 all time highs.
Also, Nasdaq can be breaking new highs due to high liquidity and also as a safe haven investment instead of Dow Industrial due to recession looming, real estate due to the gap between cost to rent @ $1850/Mo vs cost to buy @ $2700/Mo, and finally US bonds due to the lack of confidence of the us economy (Banking crisis) & the gap closing between 2 years and 10 years bonds. Investors now are preferring 2 years bonds return over 10 years bonds which reflects fear in the market.
Technically, from Elliott wave perspective, as long as 12800 level is not broken, Nasdaq futures wave iii blue should terminate between 14550 and 15300+/- followed by correction wave iv blue should drop lower than 13500 or 13140 acting as a support zone then then continue uptrend wave v blue that can extend or break 16700 level and wave 3) black is completed followed by wave 4) correction and final bull massive run wave 5) all time highs that can extend at least to 18500+/- 1.272 fib level .
Support at @ 13720 / 13300+/-
Resistance @ 14510 / 14600 / 14930 / 15220+/-
A monthly close over 15400 is highly bullish and confirms further rallies to challenge all time highs @ 16500+/- where we can either form a double top or break 16800 to achieve 18500 first target.
Note, this is a long term study that might take more than a year to be achieved and a lot of fundamentals can happen that can either change the course or accelerate the bullish scenario. Technically speaking, should anything change for my view or analysis, I will make another post. This purely objective study and traders should consider other scenarios and manage your risk properly due to market volatility.
Regards


